Am I on Track With My Money?

 기초부터 대비한 보험 새내기실손 보험은 준비하였으나 그 외 보장이 부족해요


monimo, Samsung Card’s financial super-app, entered Korea’s MyData market after its competitors. Over four months, I co-led service analysis and UX strategy with the planning lead, and owned UX planning for the assets and insurance experiences.
Users needed more than additional features. They needed a way to answer a simple question for themselves: “Am I managing my money well?”
Giving People a Reason to Come Back
Samsung had a large financial customer base, but monimo’s monthly active users remained low. People installed the app to complete financial tasks, without making it part of their everyday lives. The business needed a reason for people to return, with MAU as an indicator of progress.
When I joined, MyData account aggregation was already in place. The next challenge was to turn that financial data into useful insights. With other financial apps already offering MyData services, monimo needed to deliver value beyond bringing account information together.
Plenty of Numbers. Not Enough Answers.
People could check their assets and see which insurance and pension products they held. But those numbers alone could not tell them whether they were managing their money well, had enough coverage, or needed to make a change.
Our service analysis suggested that people lacked meaningful benchmarks for assessing their finances. Interviews with nine people who had used financial analysis features helped us understand that difficulty. Some struggled to understand their insurance coverage; others could not judge whether a recommended product suited their needs.
Information was abundant, but explanations that answered “So, am I doing okay?” were missing. We believed that helping people understand their situation and what to look into next could give them a reason to return to monimo for a financial check-in.
 조회
현황도 해석이 필요한 사용자하지만 어려운 금융 용어
“용어부터 어려우니까 진짜 이해하는데 시간이 필요해요”
“월별로 소비, 받은 혜택 등을 한눈에 알려줬으면 좋겠어요”
“고정비를 줄이고 싶은데 (...) 포인트를 찝어서 알려줬으면”
무엇을 비교해야 하는지기준을 설정하기 어려움
“보험은 실손만 알지 뭐가 필요한지 정보가 아예 없어요”
“비교하고 싶어도 이자 외에는 비교가 어려울 때”
“투자는 하고싶은데 추천하는걸 어떻게 비교해야할지(...)”
 추천
나에게 필요한 상품인지객관적으로 판단하기 어려움
“가입해도 유지가 가능할지 고민하다가 결국 미루게 돼요”
“세액 공제가 된다는데 소득 대비 얼마나 되는지 계산이(...)”
“다 좋다고 하는데 객관적으로 판단이 어려운거죠”
Could the Right Comparisons Bring Clarity?
From my past to my future. From people like me to experienced peers.
Our hypothesis was that showing changes over time alongside relevant comparison groups would help people make sense of their finances.
Comparing with their own past could reveal what had changed. Looking at peers or similar groups could help them gauge where they stood. Considering future needs could then make it easier to identify what deserved attention now.
We put the individual at the center, connecting today’s numbers with changes over time and preparation for the future.
Putting the User at the Center of Every Comparison
Learning From Competitors, Designing for monimo
We examined how competing apps moved users from viewing financial information to analysis and product recommendations. The key question was whether those patterns would also work for monimo, which brought together multiple Samsung financial businesses.
We considered where users’ attention went during analysis, whether exploration continued naturally across financial categories, and whether people had enough context to understand their situation before receiving a product recommendation. We evaluated both individual screens and the end-to-end journey.
We used that analysis to shape a flow in which people could review their information, compare and interpret it, and then consider their next step. The intent was to give users room to understand their financial lives within monimo.
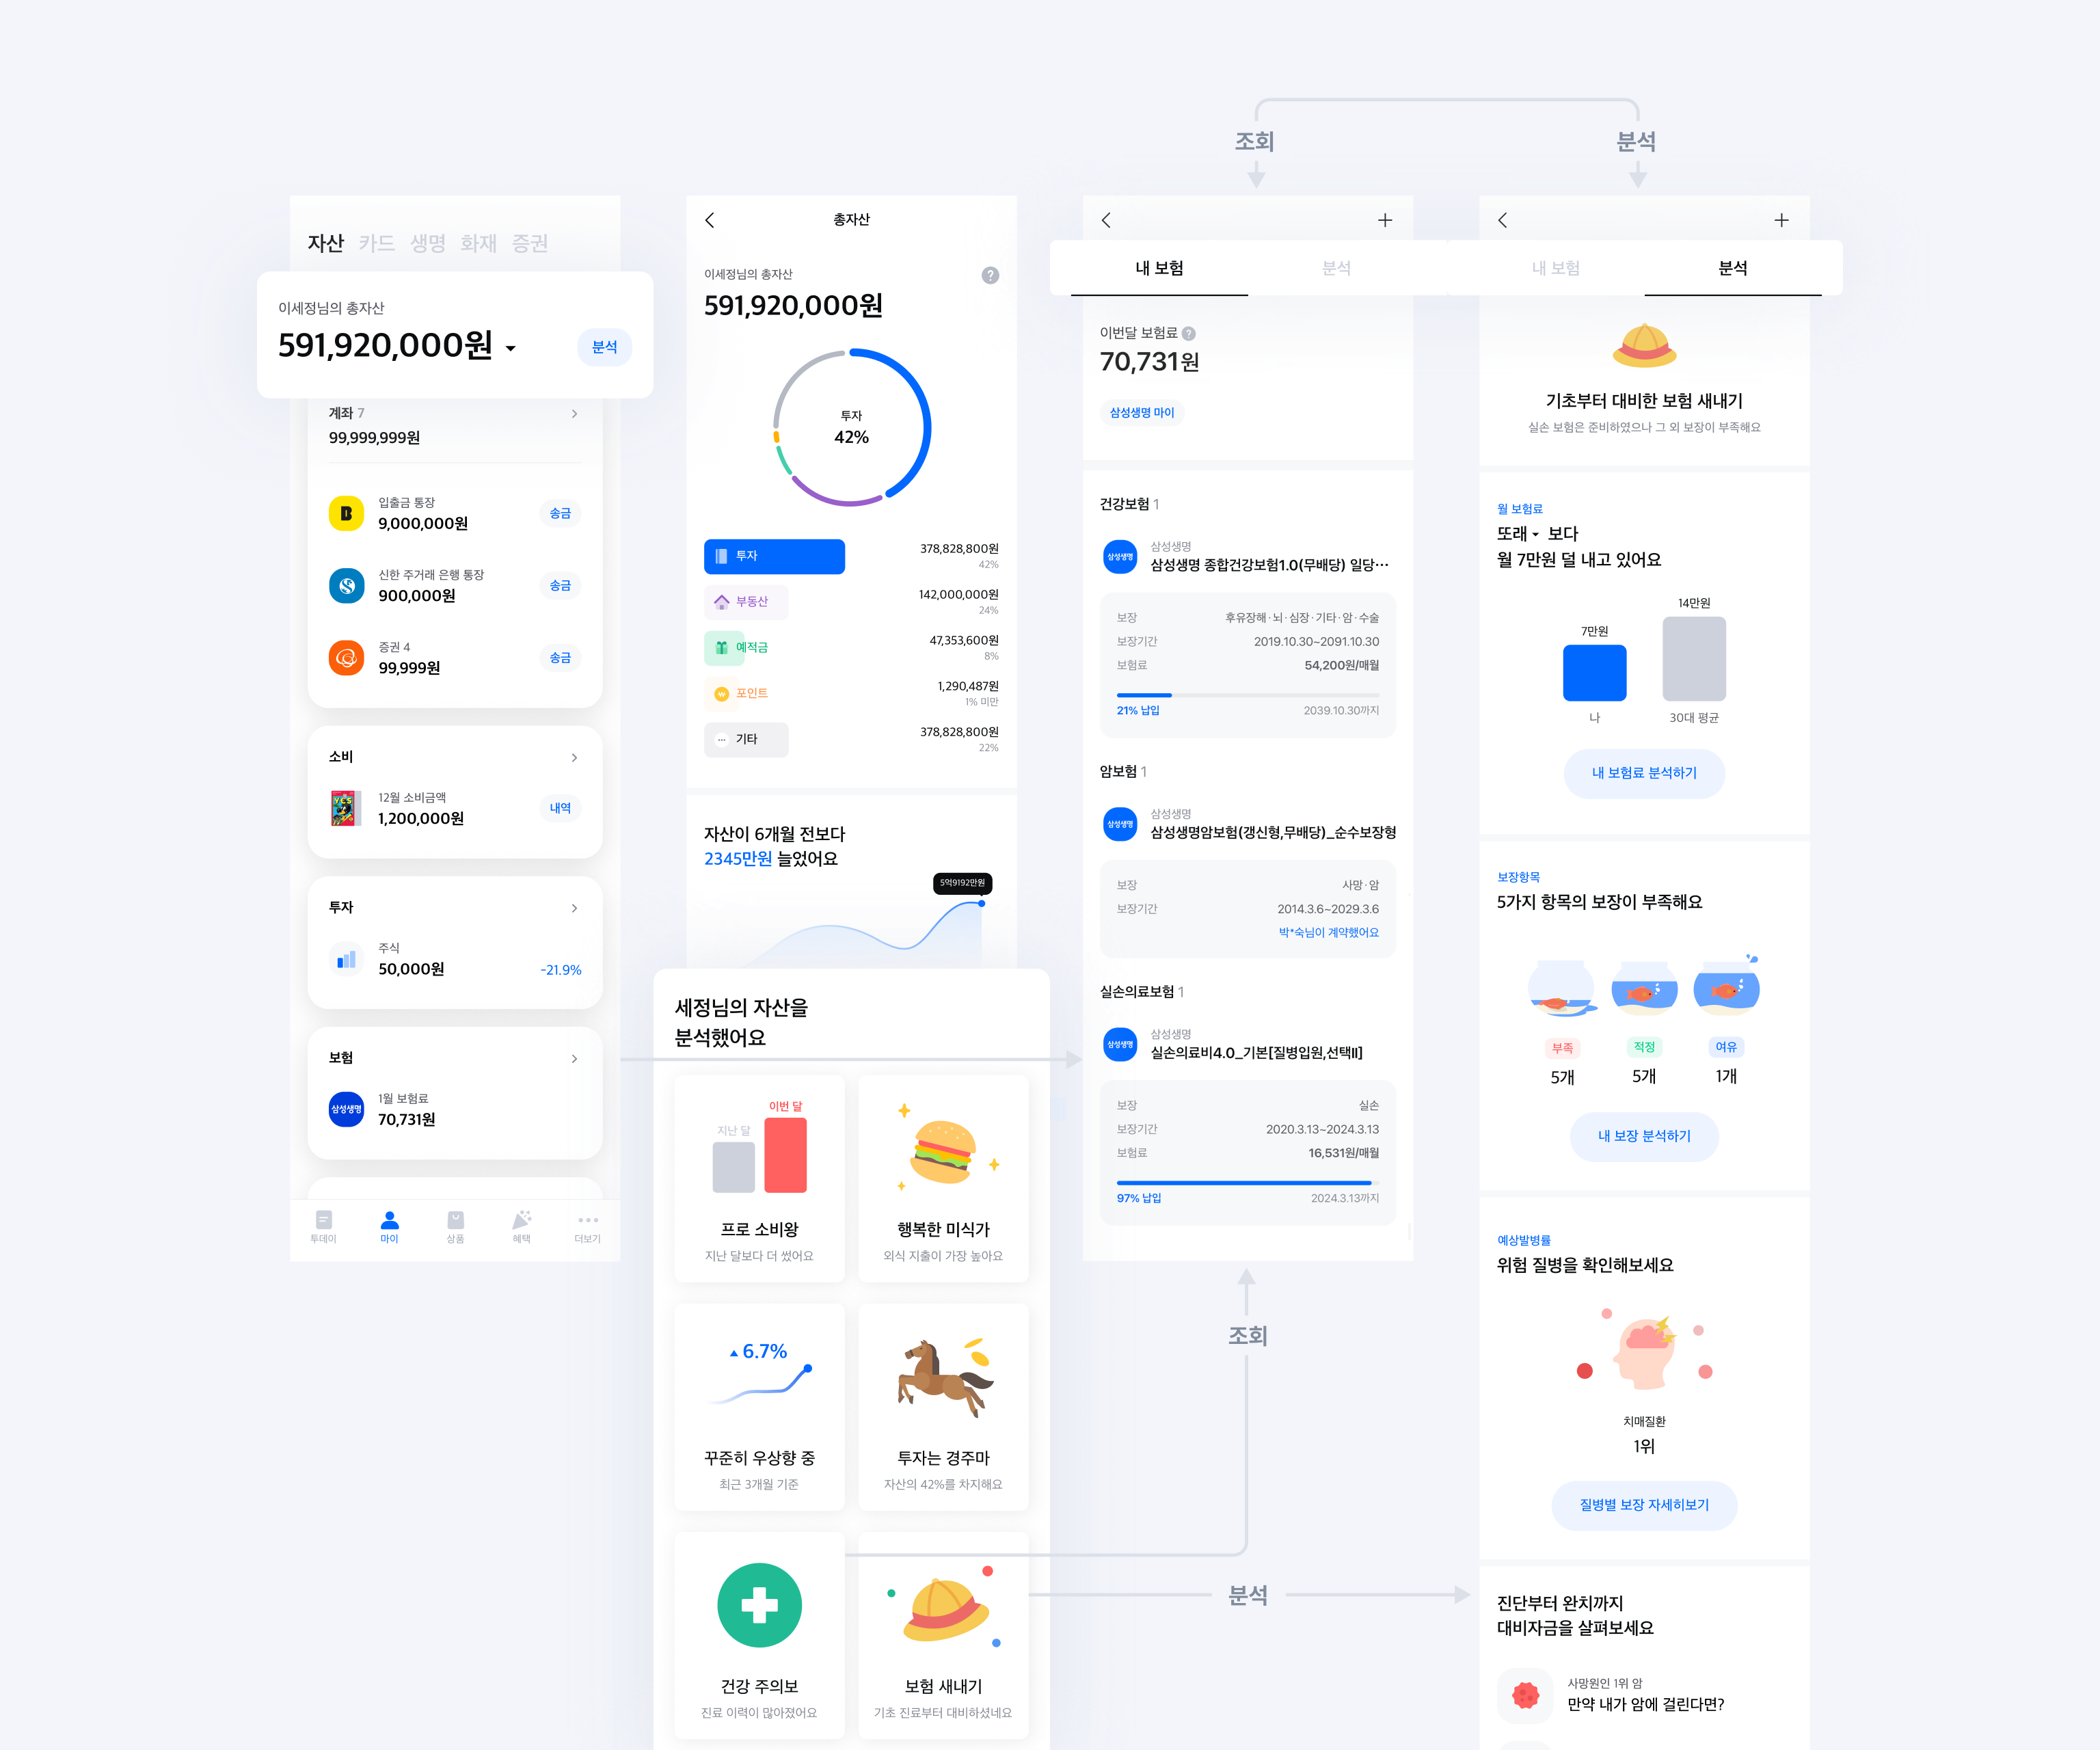
My Peers, My Past, My Future
The competitors we reviewed primarily offered comparisons with other people. We placed the user’s present situation at the center and extended the frame of reference to their own past and future.
Peers, similar groups, and experienced users could help people gauge their current position, while their own history and future needs provided additional context. Other people’s data served as a reference for understanding their own situation.
We applied this perspective across assets, insurance, and pensions so users could understand them as connected parts of one financial life.
Different Providers. One Financial Life.
Each affiliate supplied requirements, most of them framed as individual features. The subjects and criteria varied, so we first needed to work out how those requests would fit into a coherent user journey.
As a team, we broke down the requirements and identified two common dimensions: time and comparison groups. We used them to create a shared flow across financial categories: look back at changes, understand the present, and prepare for the future.
But a useful benchmark in investments was not necessarily useful in insurance. Even a “top-performing group” needed a different definition depending on the data and the analysis. We kept the user journey consistent while tailoring the criteria to each domain.
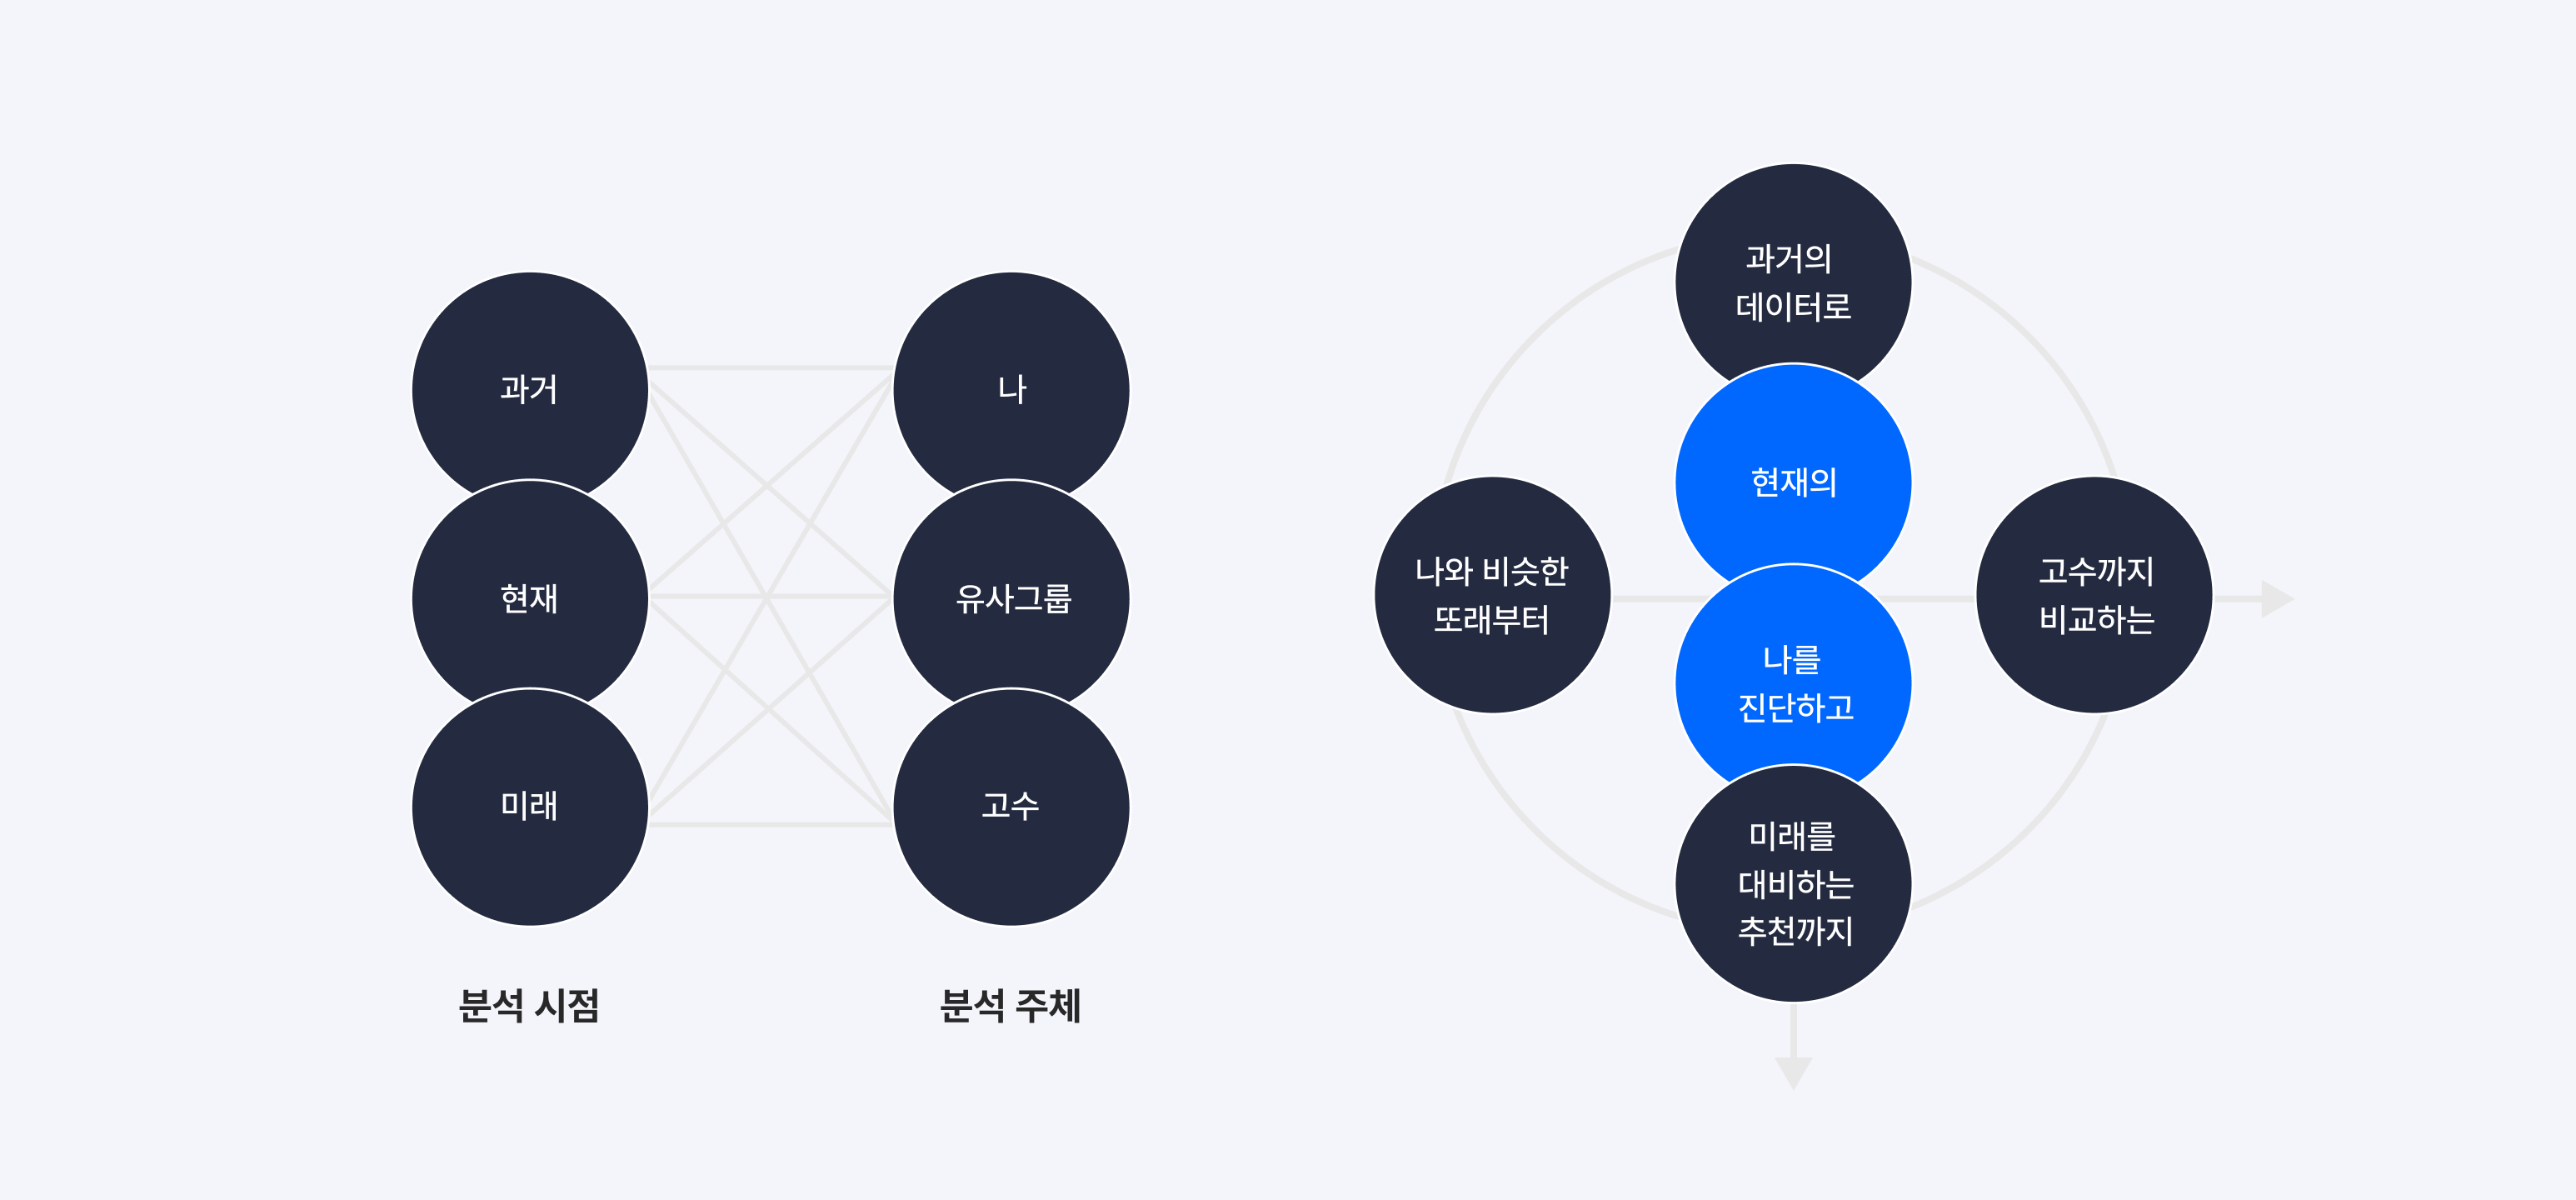
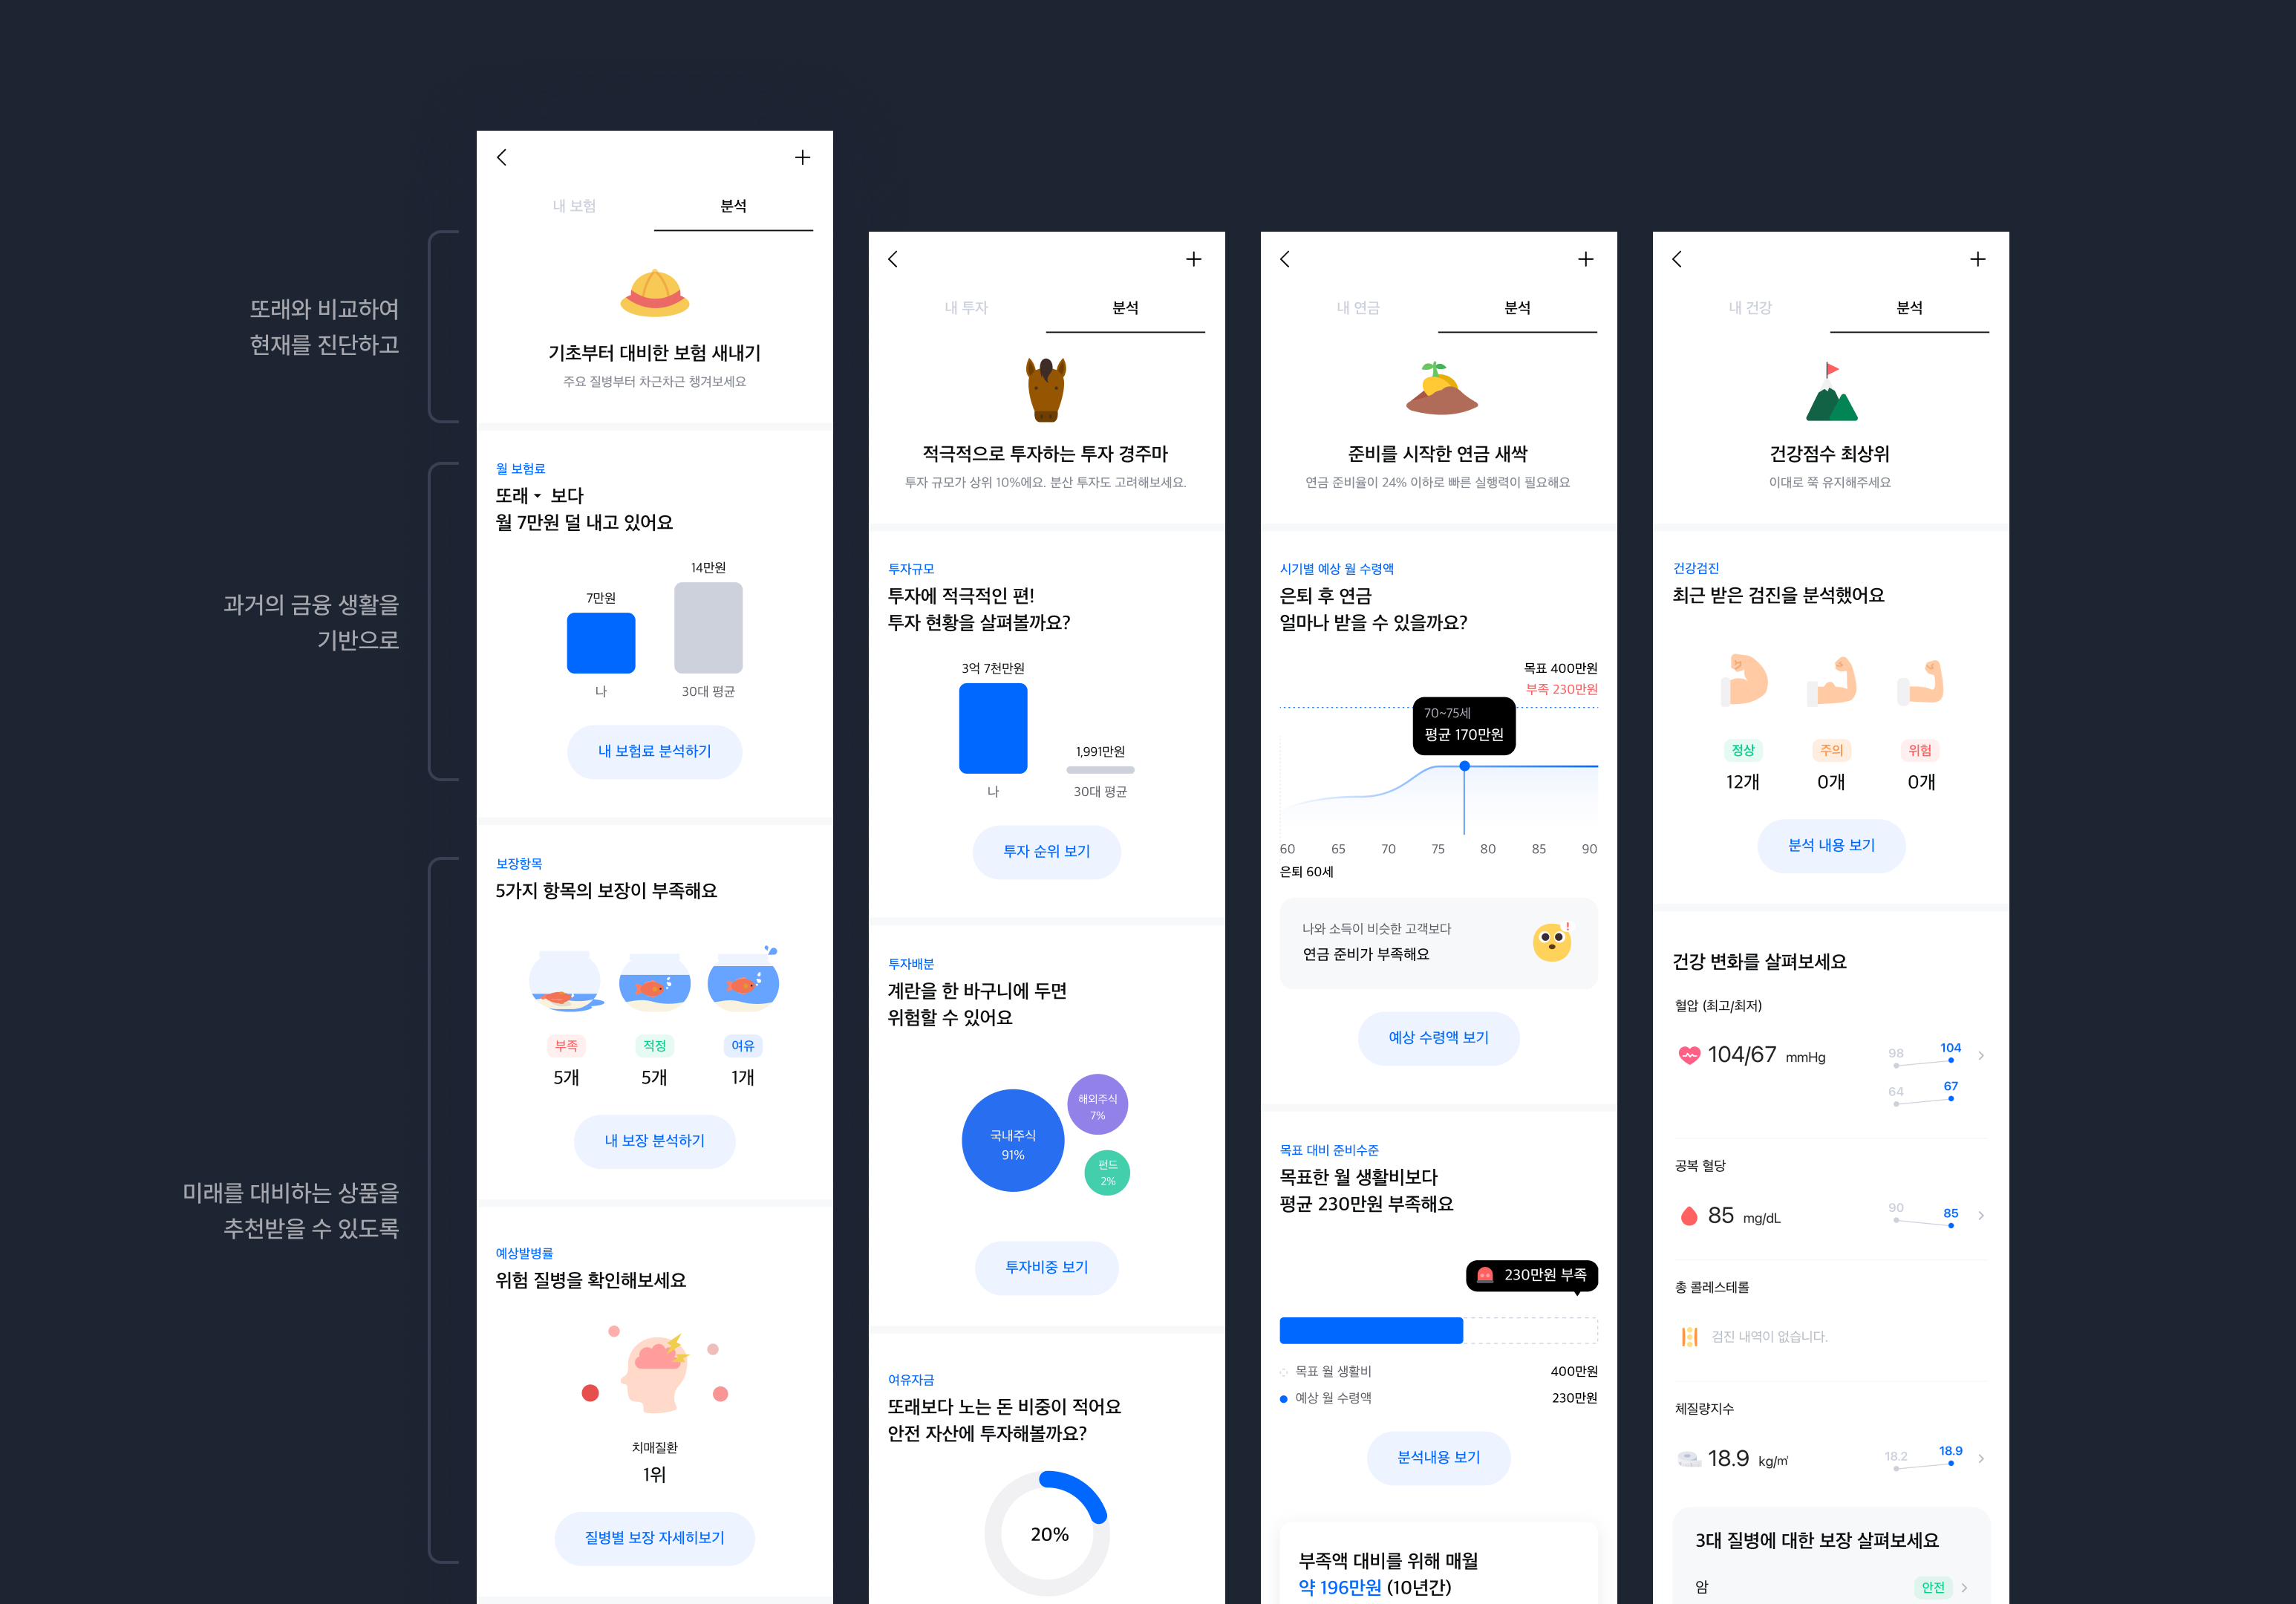
Screens That Answer “What Does This Mean for Me?”
Assets at a Glance, Details Where They Matter
Some users would notice something while reviewing their total assets. Others would arrive with a specific financial category in mind. I designed entry points that could take both groups to the analysis they needed.
The total-assets view showed the size and composition of users’ holdings, along with changes over time, then led into the details and analysis of a relevant category. Within each category, users could move from checking what they held to understanding what it meant.
The goal was to make analysis a natural next step from the information users were already viewing. I translated the strategy into information architecture and navigation between screens.
My Insurance: What Am I Paying, and What’s Covered?
For insurance, I designed a flow that began with a summary of the user’s situation, followed by premiums and coverage. The sequence helped people consider what they were paying alongside the protection they had in place.
The summary at the top gave users a quick read on their situation. The analysis below explained the comparison criteria and provided more detail. I defined the order and depth of information so people could follow a result through to its explanation.
I also designed the result categories, copy, and screen states for different analysis outcomes. This included deciding what to explain and display when comparisons changed or when data was unavailable. It brought the shared strategy into the individual messages and screens users would encounter.
기초부터 대비한 보험 새내기실손 보험은 준비하였으나 그 외 보장이 부족해요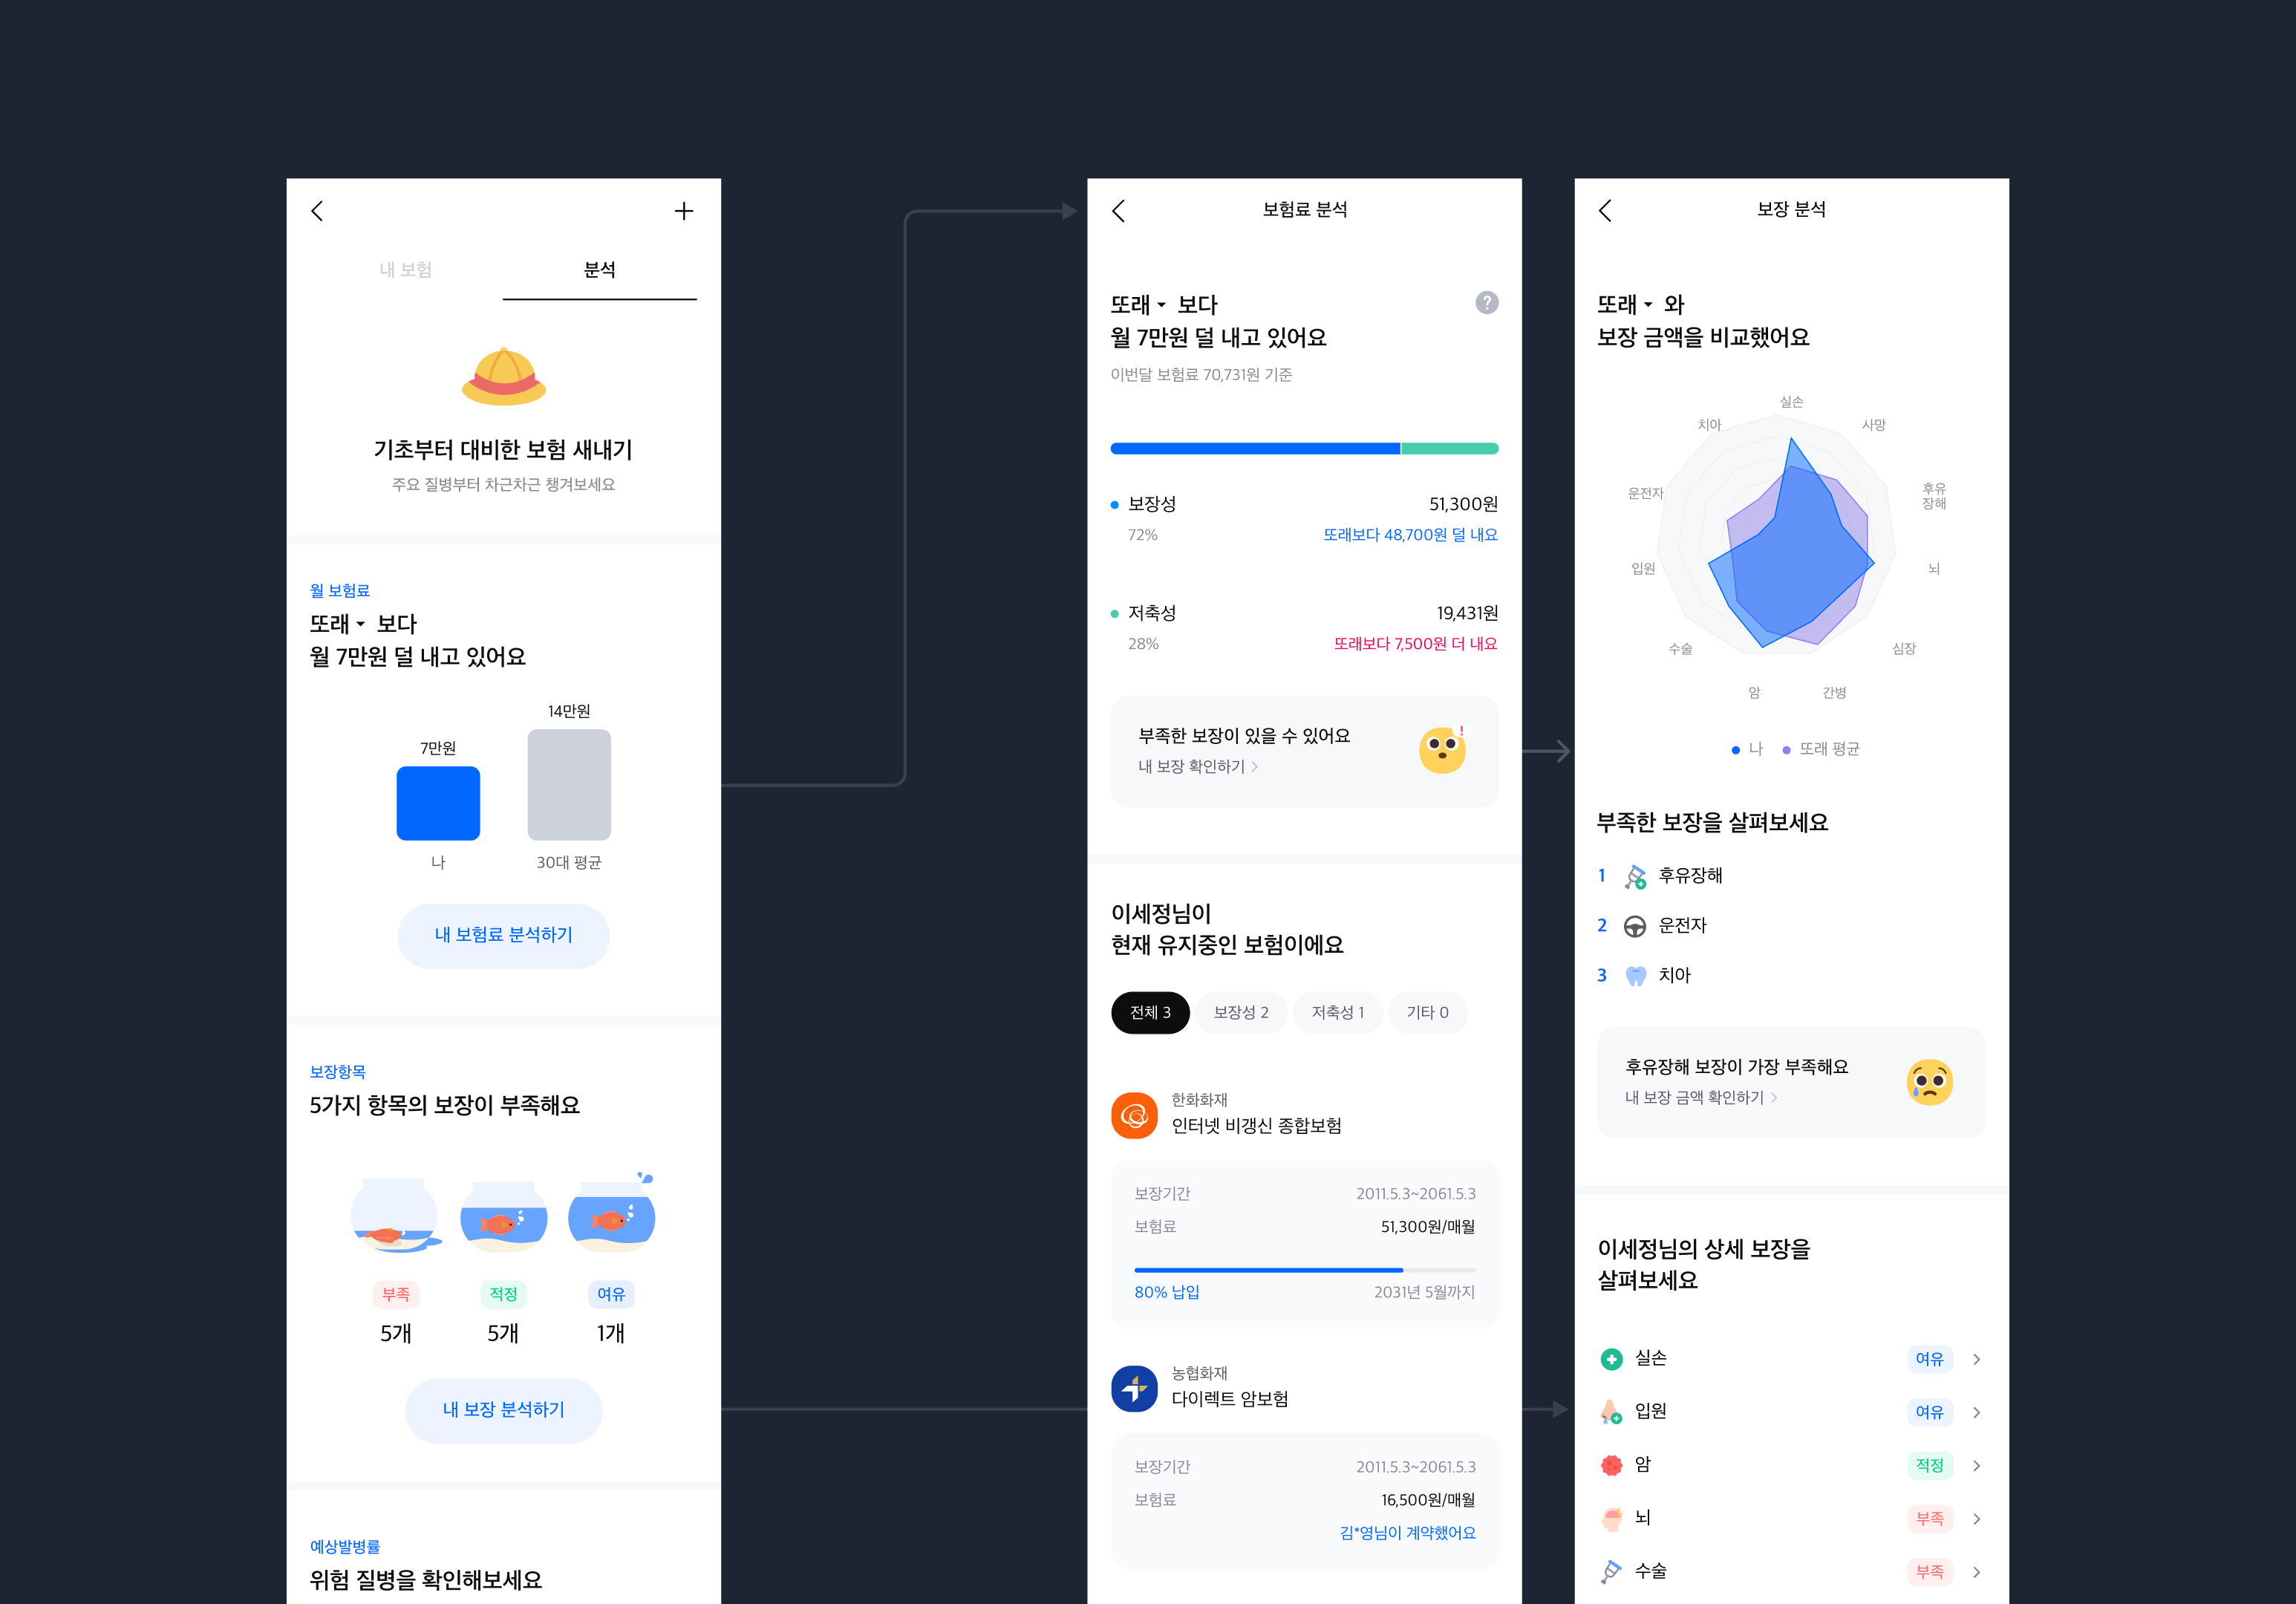
Choosing the Right Benchmarks for Insurance
Choosing “peers” or a “top-performing group” was only the starting point. We also had to determine which groups would make meaningful comparisons in the insurance data.
I worked directly with Samsung’s insurance counterpart to define those criteria. We adapted the comparison groups proposed by the team to the insurance context, and I worked through how to explain the results to users.
From those criteria, I defined user categories, wrote result copy, and specified the information on each screen. My responsibility spanned the discussion of analysis criteria through to the explanations users would read.
Monthly Active Users: 3.3M to 5.24M in a Year
Monthly active users: 3.3M → 5.24M
Between July 2023 and July 2024, monimo’s MAU increased by approximately 1.94 million, or 59%.
The analysis experience we proposed was implemented, and its core direction has continued beyond launch.
My work began with a question: what would give users a reason to return to monimo? With the planning lead, I developed a strategy across financial categories, then translated it into information architecture, analysis flows, and outcome-specific screens and copy for assets and insurance.
I brought different financial businesses’ criteria into one experience that helped users make sense of their financial lives.
MAU is an app-wide metric; it does not isolate the impact of individual features. Source: MobileIndex, as cited in the original portfolio’s results documentation.